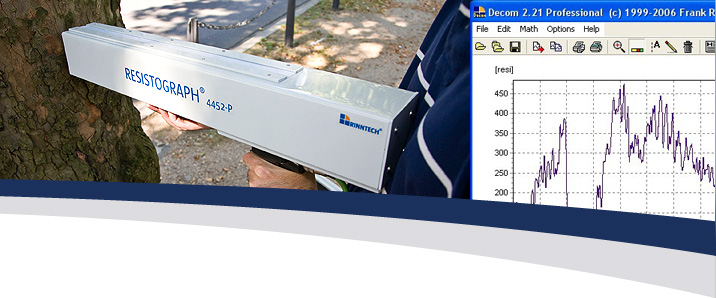
The tool for RESISTOGRAPH® profiles
 Using the DECOM™ software, you can get even more out of the profiles of your RESISTOGRAPH® . The profiles can be displayed on the screen or printed as a graphic chart, and can be processed for your reports. Mathematical and statistical routines are available for scientific applications, such as trend adjustments, tree ring detection, etc. Using the DECOM™ software, you can get even more out of the profiles of your RESISTOGRAPH® . The profiles can be displayed on the screen or printed as a graphic chart, and can be processed for your reports. Mathematical and statistical routines are available for scientific applications, such as trend adjustments, tree ring detection, etc.
Applications
- Tree check-ups
- Increment analyses
- Quality assessment of forest trees
- Wood analyses
Benefits
- Online recording of RESISTOGRAPH® data
- Graphic representation and post-processing features
- Data analysis
- Manual or automatic tree ring detection
Measurement and analysis (professional version)
- DECOM™ continuously records the RESISTOGRAPH® profiles during measurement.
- You can store additional information in the data header.
- Decay and other wood abnormalities can be specifically highlighted in the profile.
- Pictures can be integrated for a better object documentation.
- The document can be printed.
Tracing the rings tree ring detection (scientific version)
- Tree ring limits are automatically or manually marked by DECOM™.
- You can calculate the width of the tree rings as well as intra-annual density variables and store them in a format compatible with TSAP-Win™.
Mathematical functions for advanced users (scientific version)
- Using mathematical routines (e.g. trend adjustment, indexing etc.), the profiles can be analyzed even more precisely.
- Statistical data can be stored in tables and used by other programs.
|